North Carolina Per Pupil Expenditures (PPE)
More than $13 billion dollars was spent on K-12 traditional public education in North Carolina in the 2018-19 school year, including funding from local, state, and federal sources. Beginning in 2019-20, the federal Every Student Succeeds Act (ESSA) requires all states to report school-level per pupil expenditures, by funding source, for the preceding fiscal year. The availability of this never-before-released school-level data provides a new level of transparency for the public, educators, and policymakers. To help facilitate learning and exploration around this new per pupil expenditure data, BEST NC has created the interactive tool below.
The Per Pupil Expenditure Interactive Data Explorer
This data explorer allows users to identify relationships between per pupil expenditures and other school-level data. More information on how to use the data explorer can be found below.
Understanding the PPE Interactive Tool:
When using the tool, school-level per pupil expenditure values will always appear on the x-axis. Users can use the “Per Pupil Expenditure Source” drop-down menu on the right to select which expenditure source to examine: local, state, federal, or total. Using the y-axis drop down menu on the right, users can select which indicator they would like to see on the y-axis: school achievement score, school growth score, school growth index, school performance score, or percent economically disadvantaged students. Additional filters on the right can be used to narrow in on specific school characteristics and compare like schools.
The default view shows school-level data, color-coded by enrollment. Users can select the second tab to see school-level data, color-coded by the school’s geographic locale. Users can also select the “District View” Tab to see school district-level expenditure data.
Note: A small subset of schools have been excluded from this data set as outliers. If you are looking for a specific school and cannot find it here, please visit the NC School Report Card page for more information.
Breaking Down the Data:
Below are several charts featured in the 2020 edition of Facts & Figures that analyze trends within North Carolina’s school-level per pupil expenditure data.
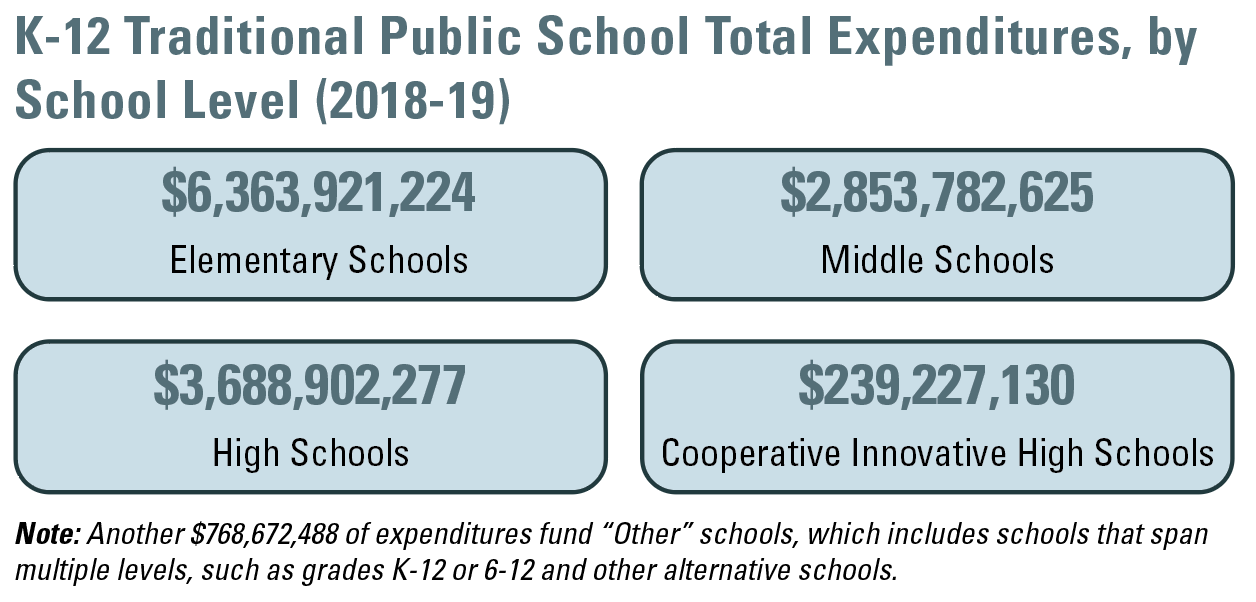
Found on page 50 of Facts & Figures 2020.
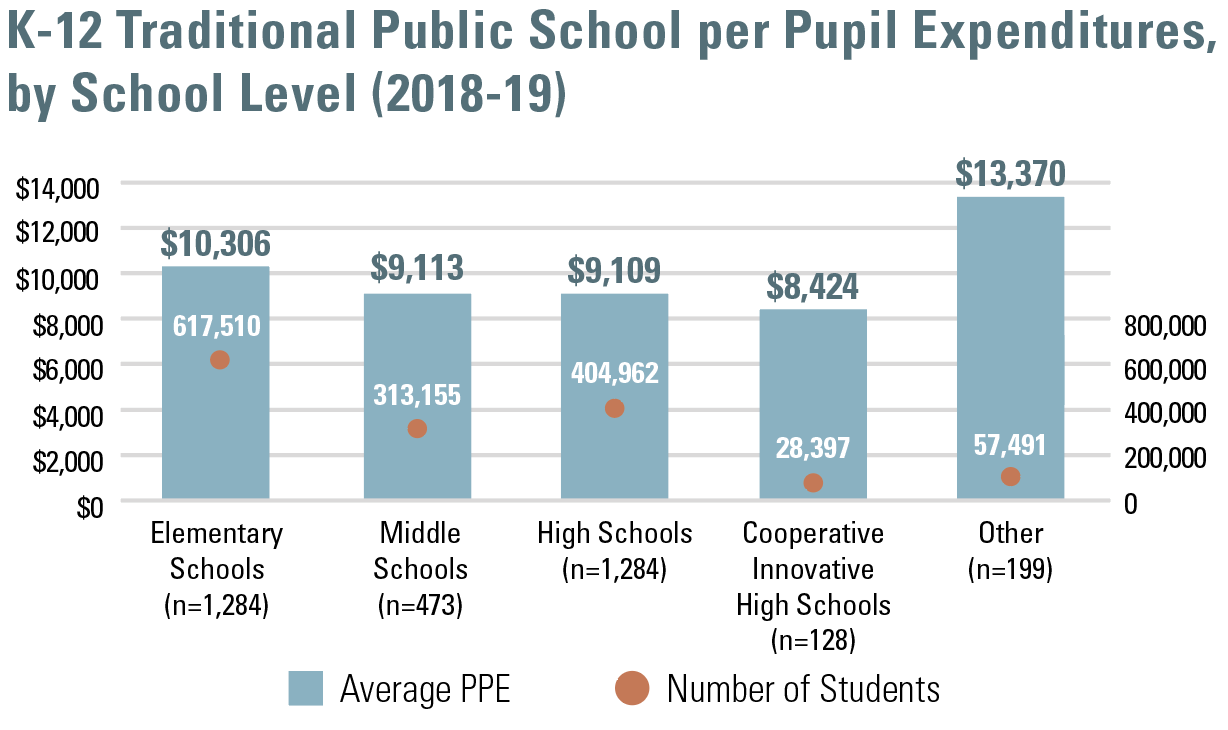
Found on page 50 of Facts & Figures 2020.
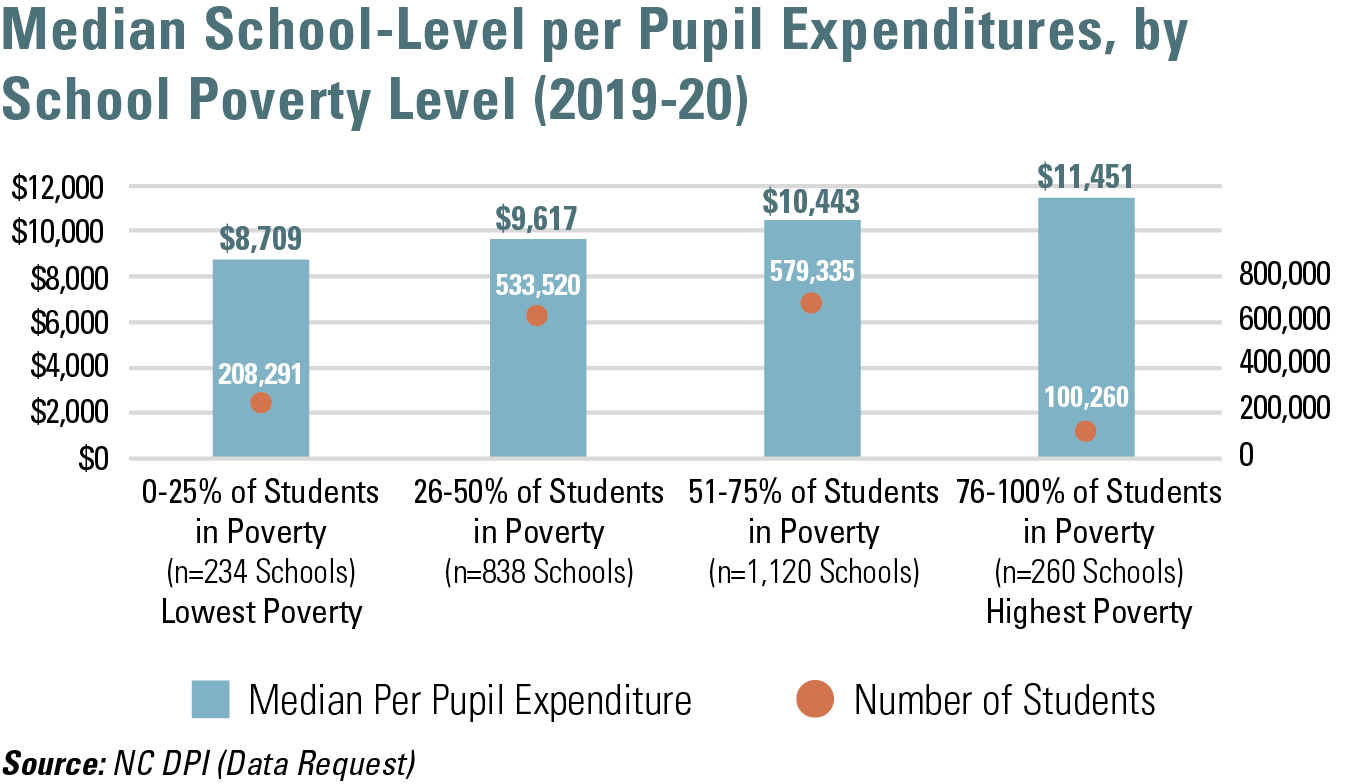
Found on page 48 of Facts & Figures 2020.
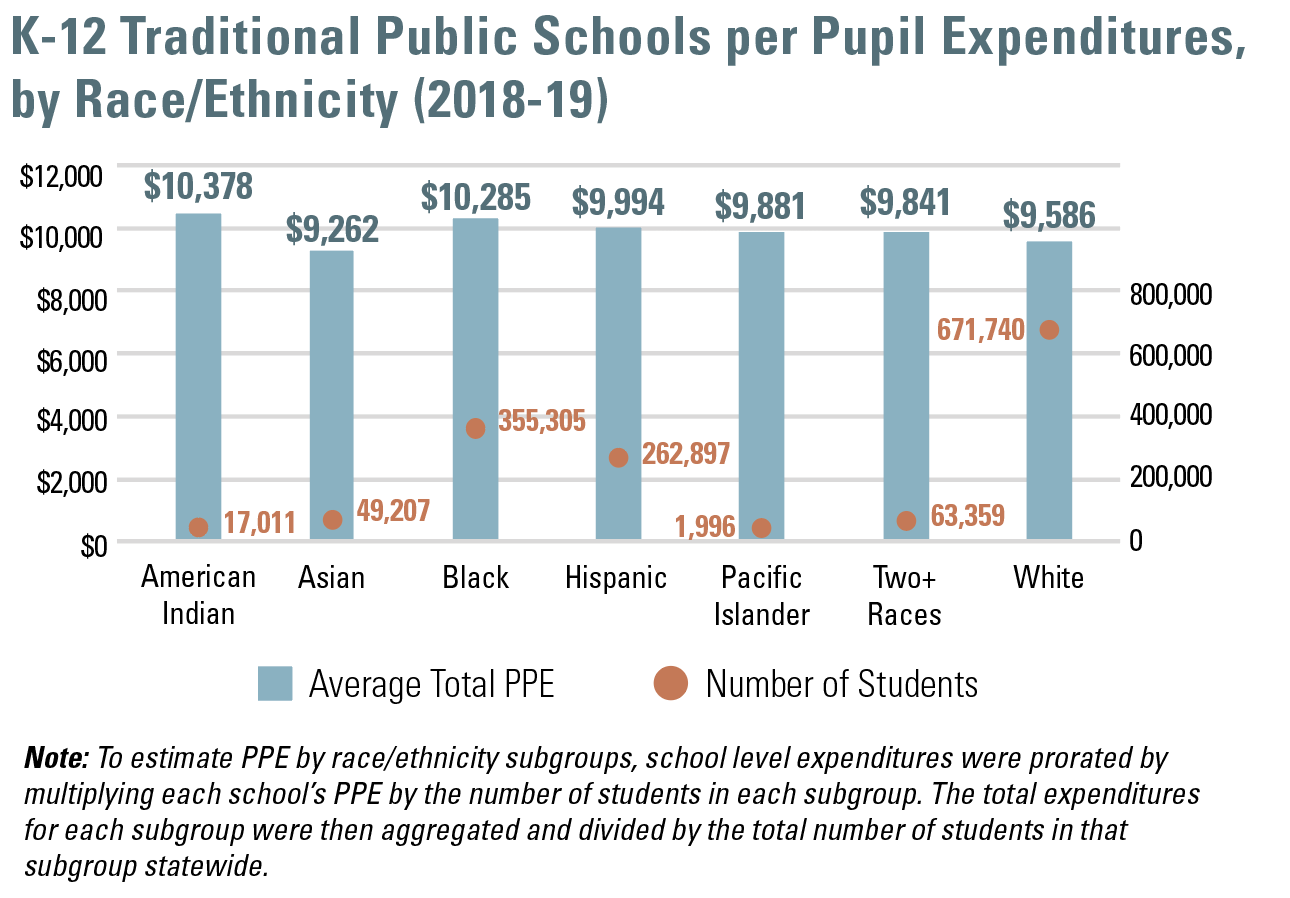
Found on page 51 of Facts & Figures 2020.
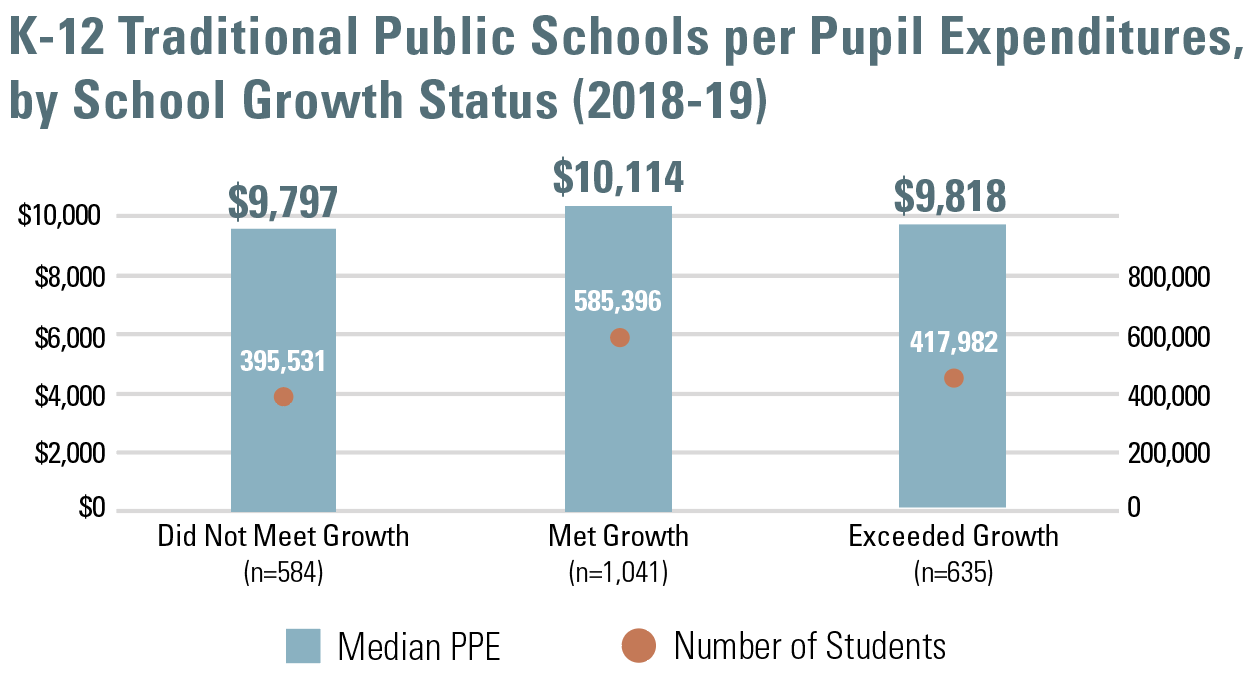
Found on page 51 of Facts & Figures 2020.
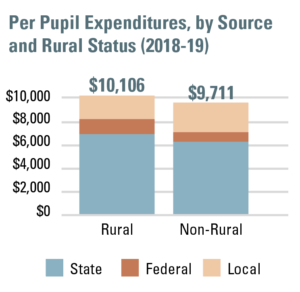
Found on page 13 of Facts & Figures 2021.
Additional Resources:
- BEST NC’s Per Pupil Expenditures Tool Announcement
- Download Your Free Copy Now: BEST NC’s Facts & Figures
- School-to-School Breakdown: NC School Report Cards
- Interactive Materials and More: NC School Finance Dashboard

